Go to the list of seismic processes.
Go to SIOSEIS introduction.
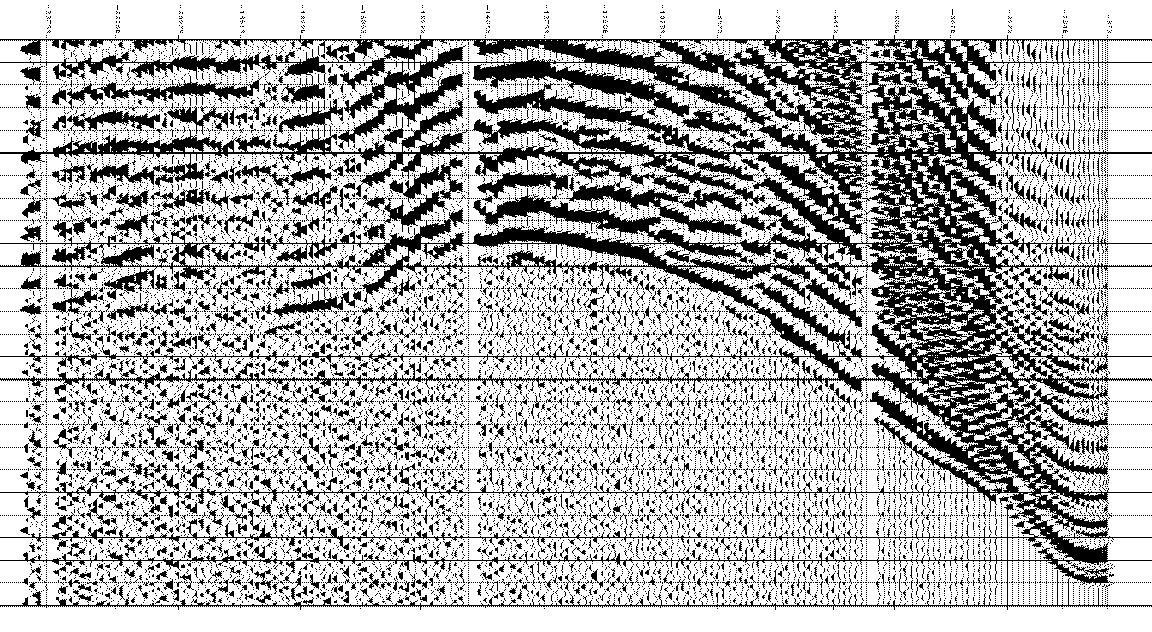
Refraction seismolgists plot the time axis as increasing time with
increasing Y (time being a positive number goes up rather than
going down as reflection seismologists do).  The X-axis is the range
from zero offset.

The plot below uses a different "weight" for the shots before the
ray emerges in an effort to see the refracted ray better.

sioseis << eof
procs diskin gains shift weight plot end
diskin
   ipath data
    end
end
gains
    type 2 rscale .5 end
end
weight
   fno 7650 lno 7671 w .1 end
   fno 7672 lno 999999 w 1 end
end
shift
   fno 0 lno 999999 redvel 6500 end
end
plot
   srpath sunfil clip .15 dir l2r ann range scalar .3
   nibs 75 hscale 1000 vscale 5 stime 1.5 nsecs 2.5 end
end
end
eof

