Go to the list of seismic processes.
Go to SIOSEIS introduction.
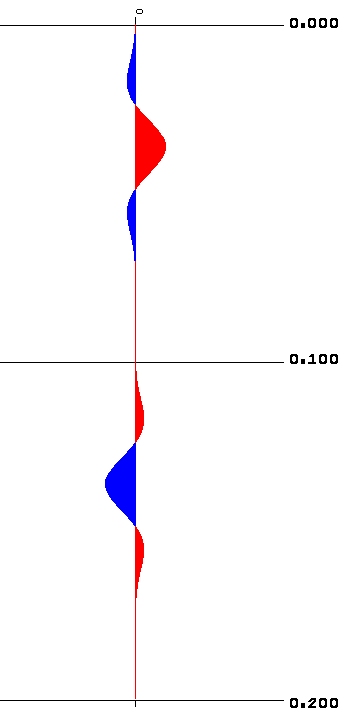
Color plots are easiest to understand if a color is given for very
small amplitudes or deflections.  The parameter COLORS is used to
describe the color of each amplitude when the deflection of the
amplitude is larger than the specified color deflections.

If there isn't a color specified near zero, PLOT will use the color
associated the next larger color deflection.  In the example below:
   colors -.3 cyan -.15 blue .15 red .3 magenta
is the same as:
   colors -.3 cyan -.00001 blue .00001 red .3 magenta


sioseis << eof
procs syn filter plot end
syn
   fno 1 lno 1 ntrcs 1 secs .2 tva .035 10000 1 .135 10000 -1 end
end
filter
   pass 10 30 end
end
plot
   nsecs .2 ann rpno anninc 50 tlines .1
   nibs 75 trpin 20 vscale 45 def .20 wiggle 0
   bcolor white
   colors -.000001 blue 0 red
   opath siofil end
end
end
eof


sio2sun siofil sunplt
xv sunplt

