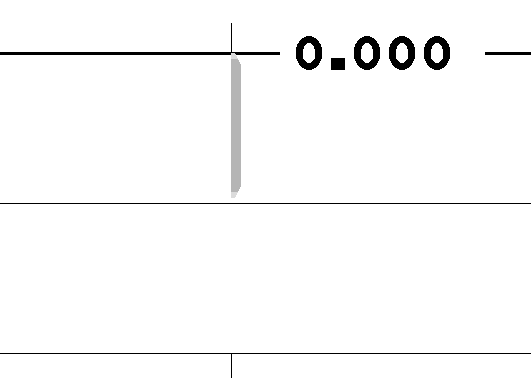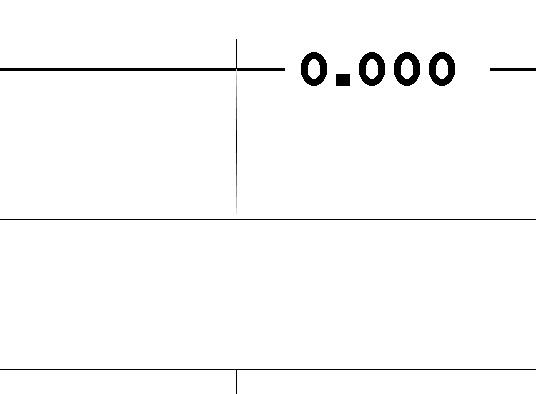
Parameter DPTR (dots per trace) limits the size of the trace in
the plot without altering the intensity. Using DPTR 1:

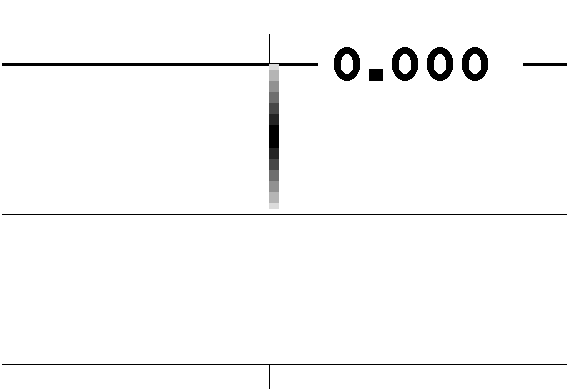
DPTR 10 causes every trace sample to be 10 dots wide on the plot:

Here are some plots and scripts that show what various plot parameters do. Along with some background in sioseis plotting. SIOSEIS plots are based on raster plotters rather than PostScript plotters. While this is for historical reasons (PostScript plotter are recent compared to raster plotters), raster plotters are the only way to plot seismic data in realtime. The basic script we'll work with is:
sioseis << eof
procs syn plot end
syn
   fno 1 lno 1 ntrcs 1 secs 1 values
 1 2 3 4 5 6 7 8 9 10 11 12 13 12 11 10 9 8 7 6 5 4 3 2 1
  0 0 0 0 0 0 0 0
  -1 -2 -3 -4 -5 -6 -7 -8 -9 -10 -11 -12 -13
  -12 -11 -10 -9 -8 -7 -6 -5 -4 -3 -2 -1
  end
end
plot
   nsecs .3 ann shotno
   nibs 2859 trpin 300 vscale 5 def .07
   colors .001 gray0 .01 gray1 .02 gray2 .04 gray3 .06 gray4
          .08 gray5 .10 gray6 .12 gray7
   opath siofil end
end
end
eof
sio2sun siofil sunfil.ras

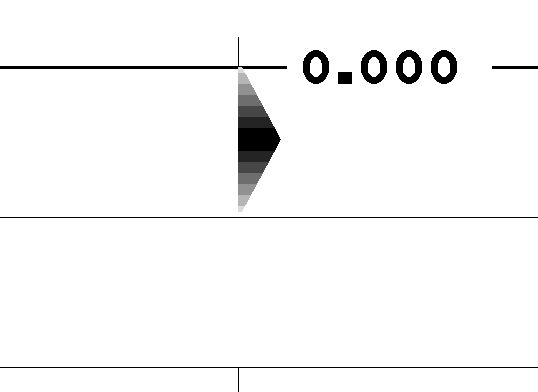
With regular black and white plotting, one often limits the the height or deflection of the wiggles by using the CLIP parameter. (Plot scales the trace to DEF inches, but then clips it so the actual excursion from zero doesn't exceed CLIP inches. With grayscale plotting, the CLIP parameter then limits the intensity of the color. e.g. Adding CLIP .03 to the above causes:Back to SIOSEIS examples. Go to SIOSEIS introduction. Go to the list of seismic processes.
Parameter DPTR (dots per trace) limits the size of the trace in the plot without altering the intensity. Using DPTR 1:

DPTR 10 causes every trace sample to be 10 dots wide on the plot:
